Wave Project
Our question asks if and how temperature affects the speed of sound. This topic could be very important for future recognition and use in other tests. We chose to study the effect of temperature on the speed of sound because this would help future projects to be more consistent. If we were to do a project in which we were testing speed of sound, the information we learned in this project would be helpful to avoid errors. For example, if we did not know that the temperature of the medium affects the speed of the waves, we might end up with skewed data because of a temperature drop or rise. This project was also helpful because it taught us how to measure the speed of sound. If we need these skills again, we will refine the method to reduce errors that have come up. To do this, you will need two people, two phones, a computer with a beeping noise, a thermometer, and a timer. With one person standing at each end of a long distance, have the timer raise their hand to signal the start for the computer person. The person with the computer will then play the beep with the timer timing. The timer will stop the stopwatch when they hear the noise. After doing this test four times on three different days, we found out that the hotter the temperature, the faster the waves travel.
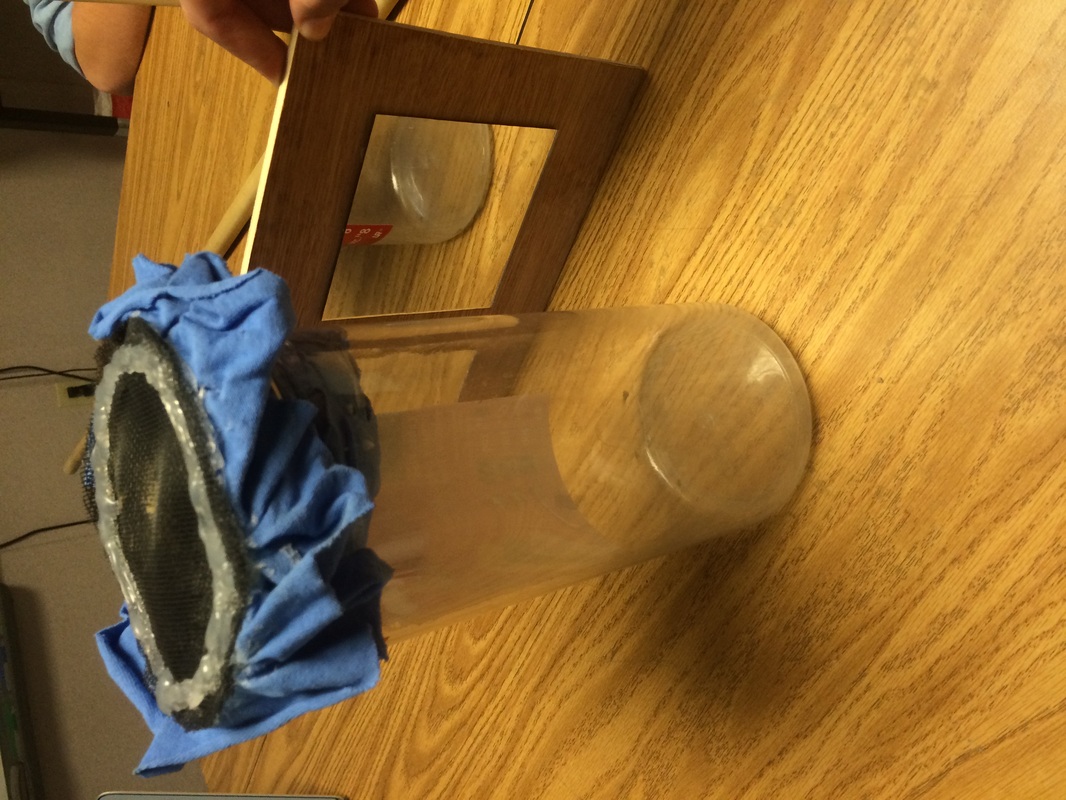
Water Filtration Project
In this project, we were asked to create a water filter for a country that is in need of clean water. Our country was Kenya, and you can read more about it in the area description below.
Avalanche project
Living in a small town at a high elevation can yield a lot of snow, or not, making it crucial to know about snow science. It was very interesting to learn about the different dangers of avalanches, and how big they really are. We also became aware of the importance of snow melt to not only our rivers, but also larger rivers and places downstream.
When we do not get a lot of snow one winter, everyone say "Oh, bummer. I wish it'd snow!!" However, not many people realize (myself included) the damage that this can have on our society. Learning about water allocations, droughts, and the impact of precipitation made me realize how important it really is to the ecosystem. For example, we learned about how there was an oasis in Mexico from the Colorado river, that has since dried up due to our water usage. Learning the truth about our daily water use was very beneficial to realize that small changes in our behaviors can make big differences.
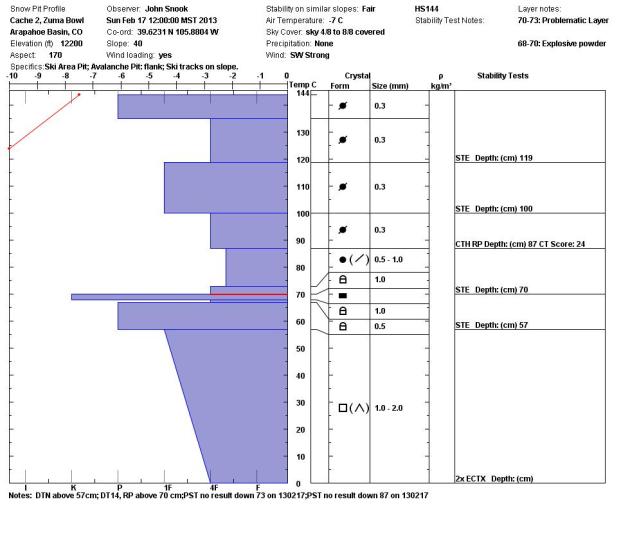
One of the things that I originally struggled with that ended up really benefitting me was learning how to read snow pit profiles. It was challenging, and at first, even with direct instruction, very difficult to understand. In the end I not only have an understanding for how to read and analyze a snow pit profile, but I will definitely be able to use this skill in the future. When we wrote our avalanche accident summary reports (below), I learned how this skill can be applied to real-life situations. Using these snow pit profiles, I could determine why the avalanche occurred.
When we do not get a lot of snow one winter, everyone say "Oh, bummer. I wish it'd snow!!" However, not many people realize (myself included) the damage that this can have on our society. Learning about water allocations, droughts, and the impact of precipitation made me realize how important it really is to the ecosystem. For example, we learned about how there was an oasis in Mexico from the Colorado river, that has since dried up due to our water usage. Learning the truth about our daily water use was very beneficial to realize that small changes in our behaviors can make big differences.
One of the things that I originally struggled with that ended up really benefitting me was learning how to read snow pit profiles. It was challenging, and at first, even with direct instruction, very difficult to understand. In the end I not only have an understanding for how to read and analyze a snow pit profile, but I will definitely be able to use this skill in the future. When we wrote our avalanche accident summary reports (below), I learned how this skill can be applied to real-life situations. Using these snow pit profiles, I could determine why the avalanche occurred.
Snow science case study
In an avalanche in Fifteen skiers in a group were caught in a slide in Arapahoe Basin, on February 16 of 2013. All fifteen were caught in the slide, but were rescued and survived. The large group of fourteen was led by one ski patroller, who had skied down to the top of a rocky patch, leading the group down the hill. The weak layer of square-crystal depth hoar broke after being disturbed from its precarious position under the hardened, compact, wind-blown layer of closely bonded circular crystals.
It was easy for this slide to occur under the prevalent terrain conditions. With a 34˚ slope, lots of unnatural pressure on the snow pack, and new snow weighing down the pack, the signs were there. The terrain was an open slope with a few scattered trees and a few rocky patches. The snow was colder on top and warmer in the middle and on the bottom, causing weaker layers. There were round crystals sitting on squares, causing an unstable snowpack. All of these components plus human contact and pressure caused the avalanche to slide at Montezuma Bowl, Arapahoe Basin.
It was easy for this slide to occur under the prevalent terrain conditions. With a 34˚ slope, lots of unnatural pressure on the snow pack, and new snow weighing down the pack, the signs were there. The terrain was an open slope with a few scattered trees and a few rocky patches. The snow was colder on top and warmer in the middle and on the bottom, causing weaker layers. There were round crystals sitting on squares, causing an unstable snowpack. All of these components plus human contact and pressure caused the avalanche to slide at Montezuma Bowl, Arapahoe Basin.
Concussion project
rocket project
(For the project description, click here.)
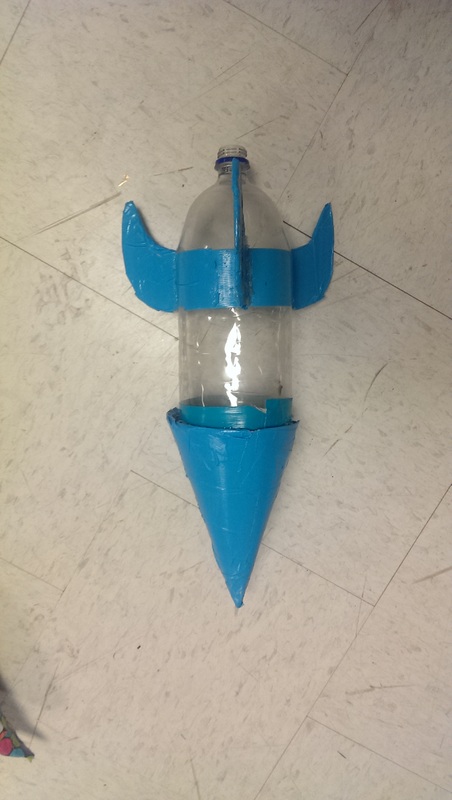
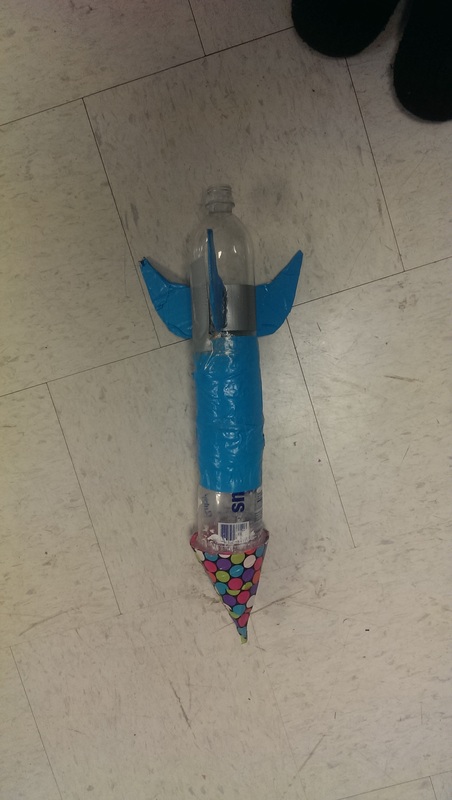
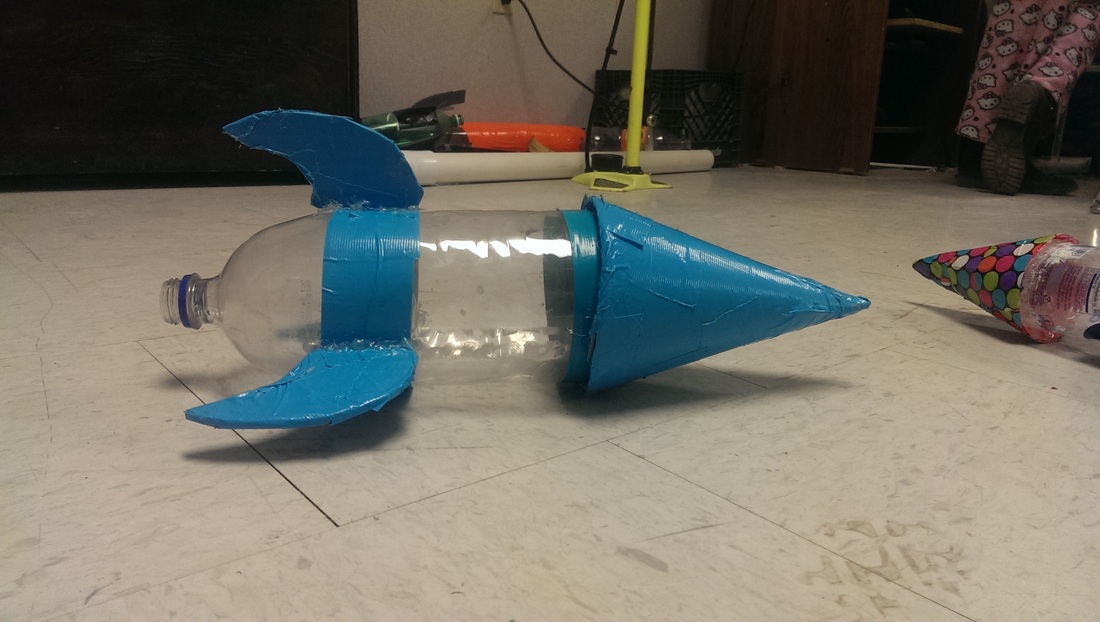
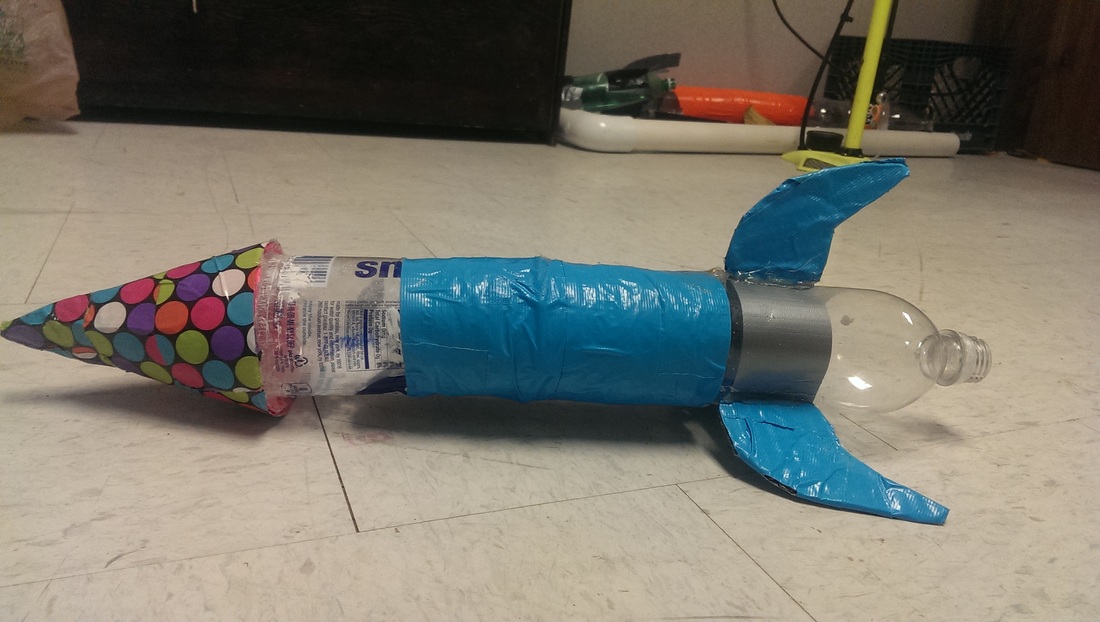
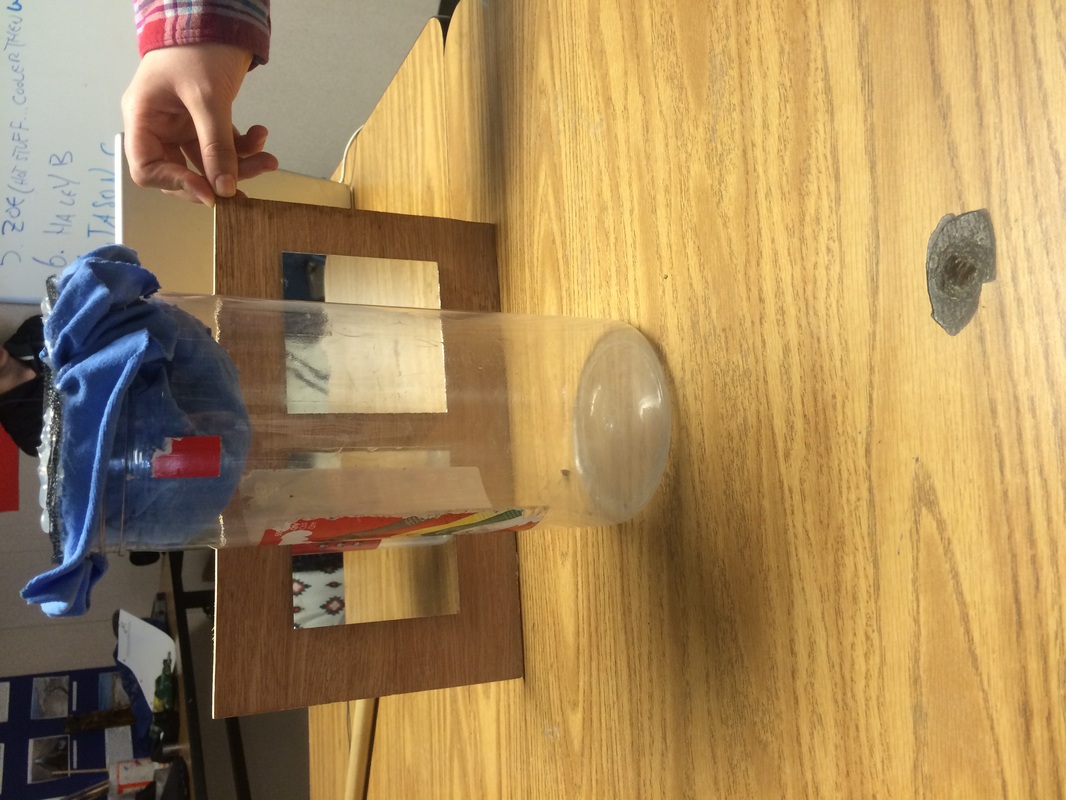
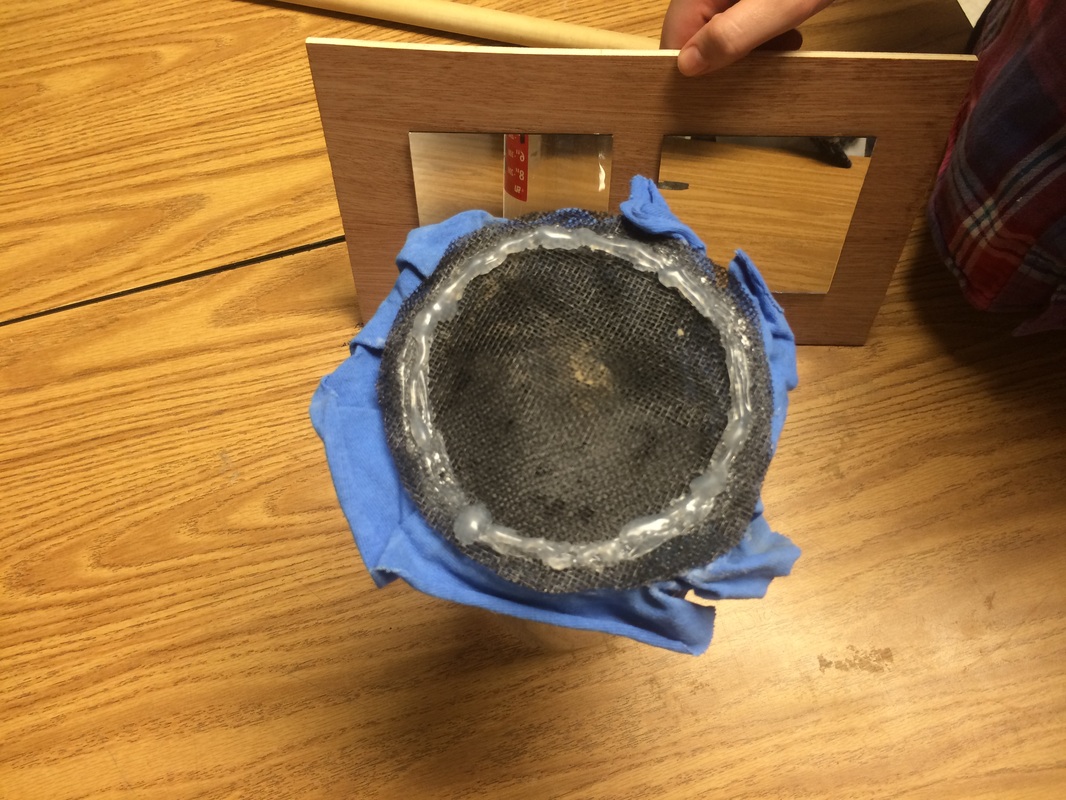
Description of rockets: "Leaky"- Our first rocket was a 2 liter smart water bottles rocket. This rocket did leak quite a bit. The rocket still shot though and pretty far for only going to 25psi. The bottle had a crooked side to it that we balanced out by making one of the sides heavier.The cone fit the rocket well with a cut folder inside and paperboard. The fins on both rockets were the same size. Whale- was the single two liter bottle with the same material for the nose cone and fins, just fit to the rockets size.
Why we chose our variable: We chose our variable, diameter, for a few reasons. First of all, we wanted something that would be a bit more of a challenge to control. We also wanted something that would have to include at least two rockets. For these reasons, we chose to use diameter as our variable.
Our question: Our question was "Does diameter affect the height of the rocket?". We could easily measure the height of our rocket by creating two different rockets with two different diameters and the same volume.
Our hypothesis: Our hypothesis was written correctly because it was an if then because statement. Also it had all of the criteria it needed. Our hypothesis stated: if diameter affects height, then a smaller diameter will go higher because it is more aerodynamic.
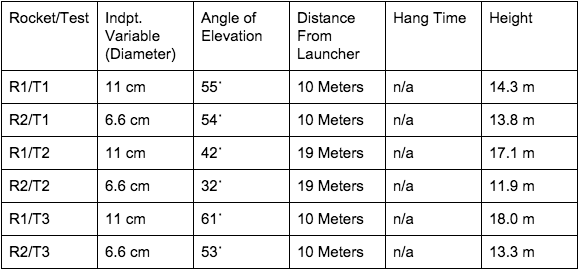
How we tested our variable: When testing our variable (diameter) we had to keep everything the same except for the diameter. We would launch the rockets and record the height. We did this very many times so we could get very accurate data. We had Ruby stand 10 meters away from the launch module and measure angle of the rocket at its peak.
Variables We Kept Constant:
Fins- All were the same size and shape.
Pressure- 25 PSI (Leaky’s max.)
Amount of water- 350 mL
Weight (mass)- Around 132 grams each
Liter size- 2 liters
One variable we couldn't keep constant: The one variable that we tried to keep constant but couldn’t was nose cone size. This was hard because one size would be too big for the other rocket, and the other would be too small. In the end, we just fitted the cone to each rocket individually rather than having the same sized cone. However, we could have found a middle size.
How we collected our data: We collected our data by finding the height. To do this, we used tangent=opposite/adjacent. We did multiple tests to get accurate results.
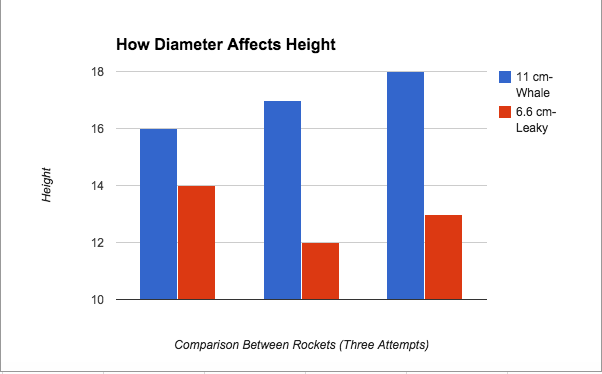
How we graphed our data: We graphed our data using google spreadsheets. We decided to use a bar graph because it gives a visual representation of how our diameter affected our height.
Conclusion: In conclusion, we found our hypothesis to be incorrect. Our hypothesis states that if diameter affects height, then a smaller diameter will go higher because it is more aerodynamic. This was incorrect because in order to keep our volume constant, we had to merge two bottles together. This caused a leak in our rocket. Also, it was bent towards one side. This created a flaw in our testing. Furthermore, we needed another point on our graph. Our last rocket that was built wasn’t able to get off the launch pad because of a major leak. For the most part we had a very successful study between the different sized rockets. The leak in our rocket was very difficult for us. Furthermore, we needed at least 3 sets of data, so we took on an additional group member. However, one of our rockets ended up not working so we only had two sets of data. To compensate for this, we did three tests per rocket to achieve more than two data sets. Our recommendation for other students building rockets is to never give up. Our teacher told us a few times that our rocket would not fly because it leaked, however it still flew higher than others. You need to be able to persevere when it gets hard because it is all worth it in the end.
Description of rockets: "Leaky"- Our first rocket was a 2 liter smart water bottles rocket. This rocket did leak quite a bit. The rocket still shot though and pretty far for only going to 25psi. The bottle had a crooked side to it that we balanced out by making one of the sides heavier.The cone fit the rocket well with a cut folder inside and paperboard. The fins on both rockets were the same size. Whale- was the single two liter bottle with the same material for the nose cone and fins, just fit to the rockets size.
Why we chose our variable: We chose our variable, diameter, for a few reasons. First of all, we wanted something that would be a bit more of a challenge to control. We also wanted something that would have to include at least two rockets. For these reasons, we chose to use diameter as our variable.
Our question: Our question was "Does diameter affect the height of the rocket?". We could easily measure the height of our rocket by creating two different rockets with two different diameters and the same volume.
Our hypothesis: Our hypothesis was written correctly because it was an if then because statement. Also it had all of the criteria it needed. Our hypothesis stated: if diameter affects height, then a smaller diameter will go higher because it is more aerodynamic.
How we tested our variable: When testing our variable (diameter) we had to keep everything the same except for the diameter. We would launch the rockets and record the height. We did this very many times so we could get very accurate data. We had Ruby stand 10 meters away from the launch module and measure angle of the rocket at its peak.
Variables We Kept Constant:
Fins- All were the same size and shape.
Pressure- 25 PSI (Leaky’s max.)
Amount of water- 350 mL
Weight (mass)- Around 132 grams each
Liter size- 2 liters
One variable we couldn't keep constant: The one variable that we tried to keep constant but couldn’t was nose cone size. This was hard because one size would be too big for the other rocket, and the other would be too small. In the end, we just fitted the cone to each rocket individually rather than having the same sized cone. However, we could have found a middle size.
How we collected our data: We collected our data by finding the height. To do this, we used tangent=opposite/adjacent. We did multiple tests to get accurate results.
How we graphed our data: We graphed our data using google spreadsheets. We decided to use a bar graph because it gives a visual representation of how our diameter affected our height.
Conclusion: In conclusion, we found our hypothesis to be incorrect. Our hypothesis states that if diameter affects height, then a smaller diameter will go higher because it is more aerodynamic. This was incorrect because in order to keep our volume constant, we had to merge two bottles together. This caused a leak in our rocket. Also, it was bent towards one side. This created a flaw in our testing. Furthermore, we needed another point on our graph. Our last rocket that was built wasn’t able to get off the launch pad because of a major leak. For the most part we had a very successful study between the different sized rockets. The leak in our rocket was very difficult for us. Furthermore, we needed at least 3 sets of data, so we took on an additional group member. However, one of our rockets ended up not working so we only had two sets of data. To compensate for this, we did three tests per rocket to achieve more than two data sets. Our recommendation for other students building rockets is to never give up. Our teacher told us a few times that our rocket would not fly because it leaked, however it still flew higher than others. You need to be able to persevere when it gets hard because it is all worth it in the end.